

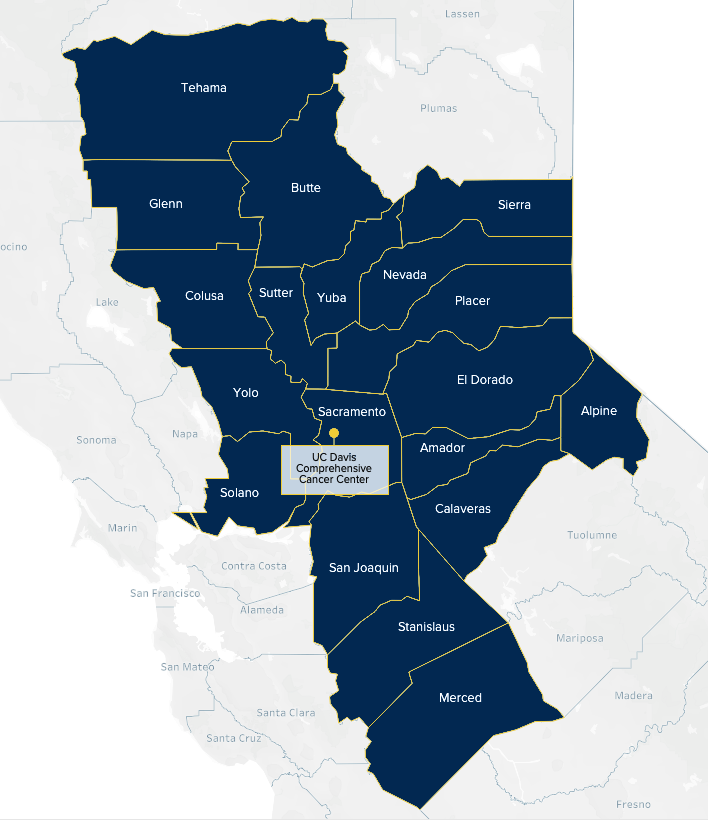
Our Catchment Area
UC Davis Comprehensive Cancer Center’s “catchment area,” the area it serves, is comprised of 19 counties that cover 23,800 square miles (approximately the size of West Virginia). Of these counties, eight are considered rural. According to the 2020 Census, the region has 5,165,758 residents, an increase of 10.74% since 2010. In total, 90% of our cancer center patients reside in this large region. The Cancer Center’s catchment area is one of the most geographically and ethnically diverse in the nation, which creates opportunities to engage with many people in a meaningful and impactful way. The catchment area also accounts for 28% of California’s total land in farming (i.e., cropland, pastureland, woodland). In fact, three of the counties in the catchment area are among California’s top ten agricultural counties (Stanislaus, Merced, and San Joaquin).
Demographics of region
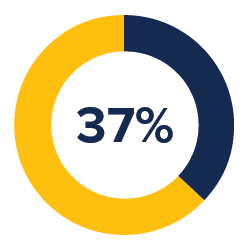
37% speak a non-English language at home.
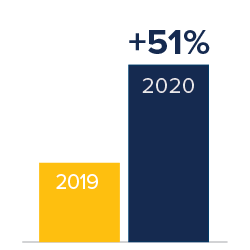
Between the 2010 and 2020, our catchment area saw a 51% increase in the population aged 65 and older, as per the U.S. Census.
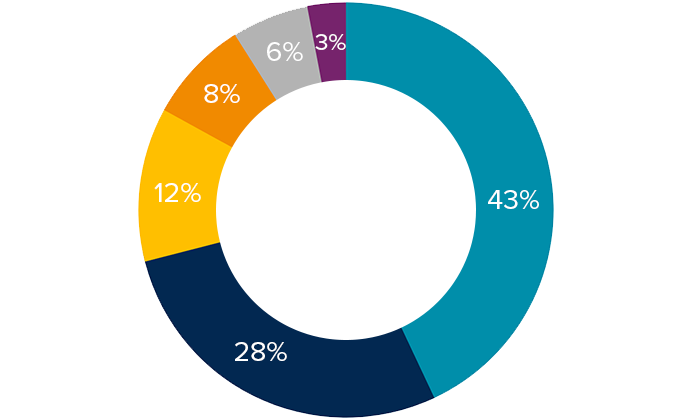
Catchment area diversity breakdown:
White: 43%
Hispanic or Latinx: 28%
Asian or Pacific Islander: 12%
Black or African American: 8%
Other: 6%
American Indian/Alaskan Native: 3%
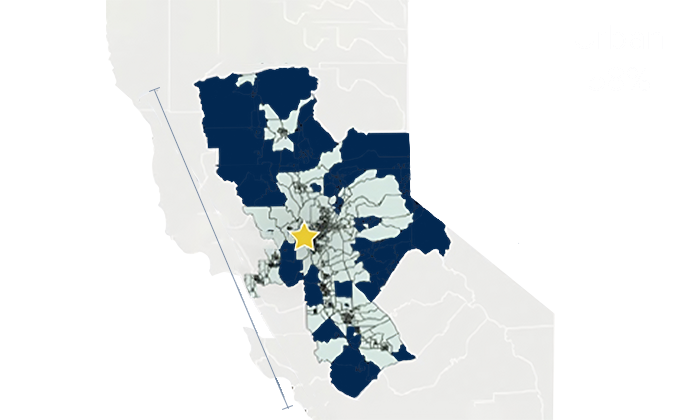
According to Rural-Urban Commuting Area codes, the catchment area for this program includes 19 counties:
Urban: 42%
Rural: 58%
Two hour drive from UC Davis Comprehensive Cancer Center.
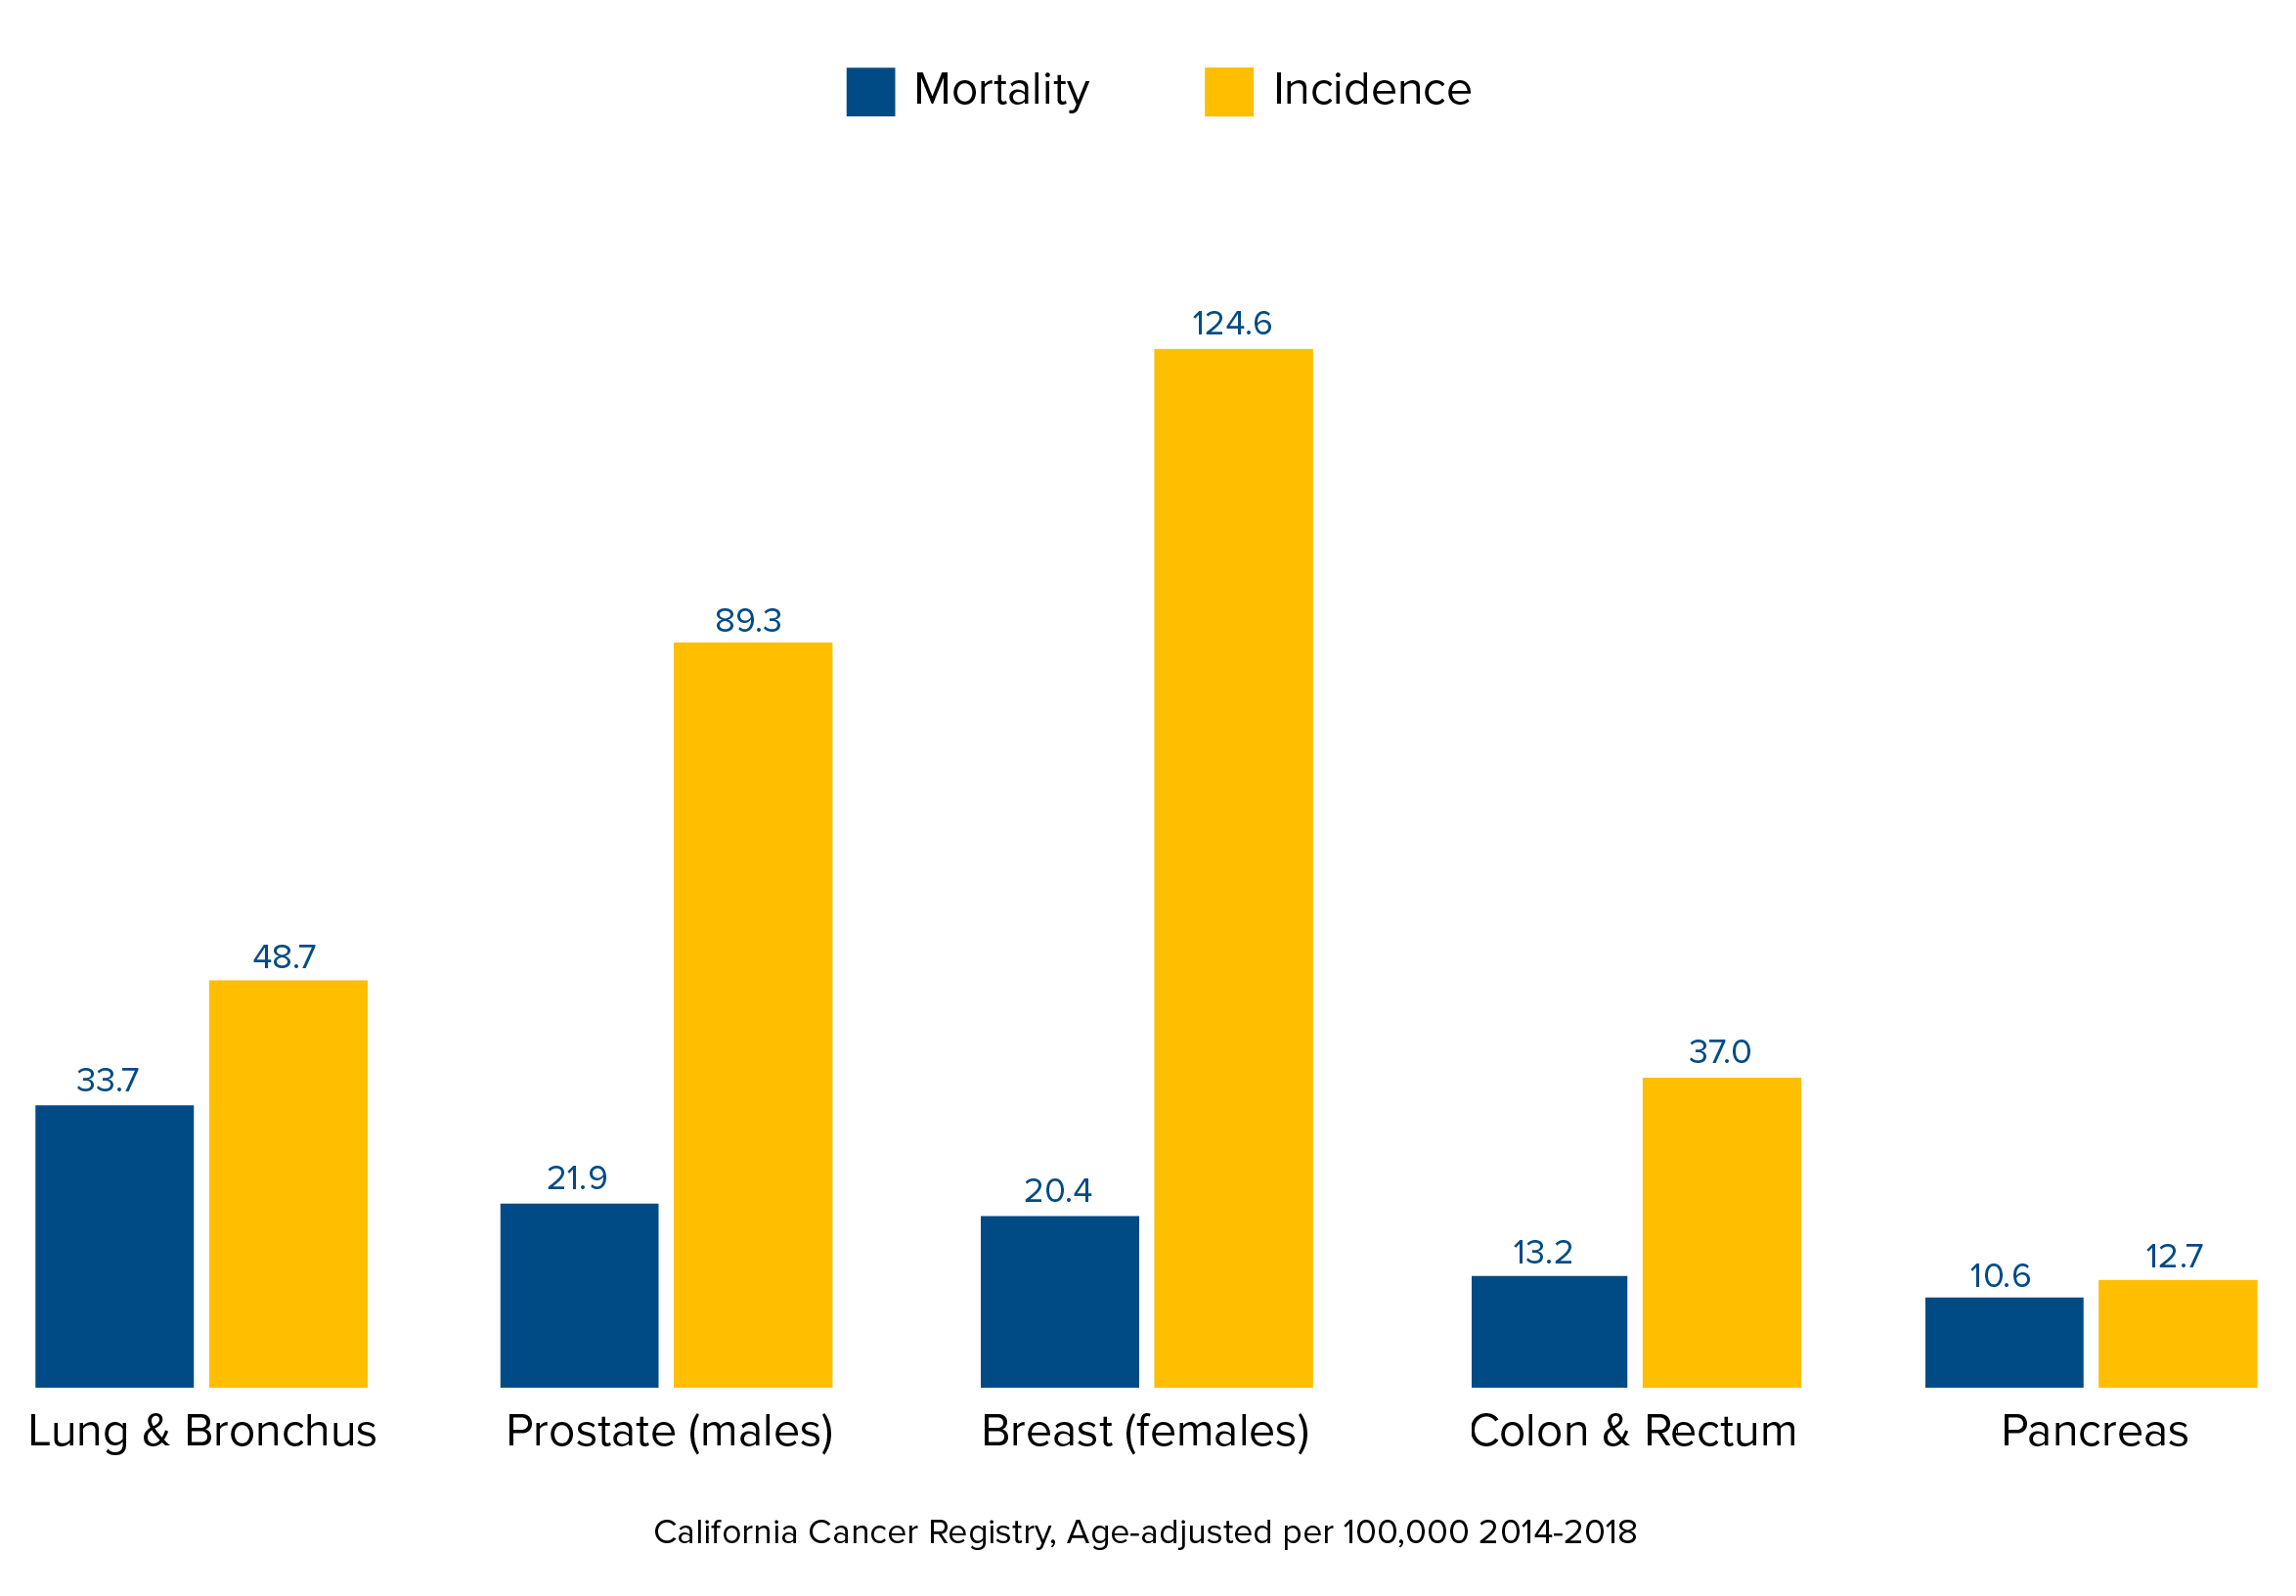
Cancer Burden in Our Catchment Area
UCDCCC Catchment Area Cancer Burden, 2014-2018
Factors That Impact Cancer Risk
Risks associated with a person’s chances of developing cancer include genetic, behavioral, environmental, and socioeconomic factors. While genetics are not considered modifiable, the other factors below can be influenced by behaviors.
Food insecurity: Food insecurity is a household-level economic and social condition of limited or uncertain access to adequate food.
| Catchment | CA average |
|---|---|
| 15.7% | 12.7% |
Poverty among all individuals: Poverty is the state of one who lacks the means to basic needs. Those living below the national poverty line of $12,880 a year for a single individual are considered to be living in poverty.
| Catchment | CA average |
|---|---|
| 14.8% | 13.4% |
Unemployed: Unemployed individuals are those who are jobless, looking for a job, and available for work.
| Catchment | CA average |
|---|---|
| 4.3% | 3.9% |
Uninsured: Uninsured individuals are not covered by a third party like Medicare, Medicaid, Workers Compensation, or an insurance company meaning they have to pay for their services.
| Catchment | CA average |
|---|---|
| 5.8% | 7.5% |
Pesticides: Pesticides are chemicals used to control insects, weeds and plant diseases. Over 1,000 pesticides are registered for use in California. They are applied to fields by air, by farm machinery, or by workers on the ground. Farmworker families and other people who live near fields can be exposed to pesticides, both outdoors and inside homes. Exposure to high levels of some pesticides can cause illness right away or conditions such as birth defects or cancer later in life.
Pesticides Use Percentile
 |
 |
In percentile(%)
Current smoking: A current smoker is an adult who has smoke 100 cigarettes in their lifetime and who currently smokes cigarettes.
| Catchment | CA average |
|---|---|
| 14.9% | 13.3% |
Obesity: Obesity is weight that is unhealthy for a given height and presents risk to health.
| Catchment | CA average |
|---|---|
| 29.2% | 26.4% |
It is important to note cancer screening rates reflect both highly urban and rural areas. The lower cancer screening rates may be attributable to potential barriers rural areas could be facing with regard to screening efforts. All individuals eligible for screening should get their appropriate screenings to prevent cancer and reduce the cancer burden.
*The target percentage for 2020 was included to emphasize the ongoing need for improvement in both the catchment area and California as a whole, as outlined by the goals in California's Comprehensive Control Plan for 2021-2025 prepared by the California Dialogue on Cancer and supported by CDC data.
Mammography screening: Mammography screening is an x-ray picture of the breast to check for breast cancer in women who have no signs or symptoms of the disease.
| Catchment | CA average | Target for 2020* |
|---|---|---|
| 77.2% | 78.0% | 86.6% |
Cervical cancer screening: Cervical cancer screening includes cervical cytology (also known as the Pap smear), testing for human papillomavirus (HPV), or both to find changes in the cells of the cervix that could lead to cervical cancer.
| Catchment | CA average | Target for 2020* |
|---|---|---|
| 82.7% | 82.2% | 92% |
Colorectal cancer screening: Colorectal cancer screening are procedures that can detect polyps and early cancers in the large intestine.
| Catchment | CA average | Target for 2020* |
|---|---|---|
| 67.2% | 66.1% | 80.0% |
References:
UCSF Health Atlas. University of California, San Francisco School of Medicine Dean’s Office of Population Health and Health Equity, 2022. Accessed from: https://www.healthatlas.ucsf.edu
CalEnviroScreen 4.0 Indicator Maps. California Office of Environmental Health Hazard Assessment. 2022. Accessed from: https://oehha.ca.gov/calenviroscreen/report/calenviroscreen-40
Centers for Disease Control and Prevention (CDC). Behavioral Risk Factor Surveillance System Survey Questionnaire. Atlanta, Georgia: U.S. Department of Health and Human Services, Centers for Disease Control and Prevention, 2020